
Note: this article covers aggregations used when building a Dataset. If you are looking for how Workbooks aggregate and display information visually, see the Measure Aggregations in Metrics article.
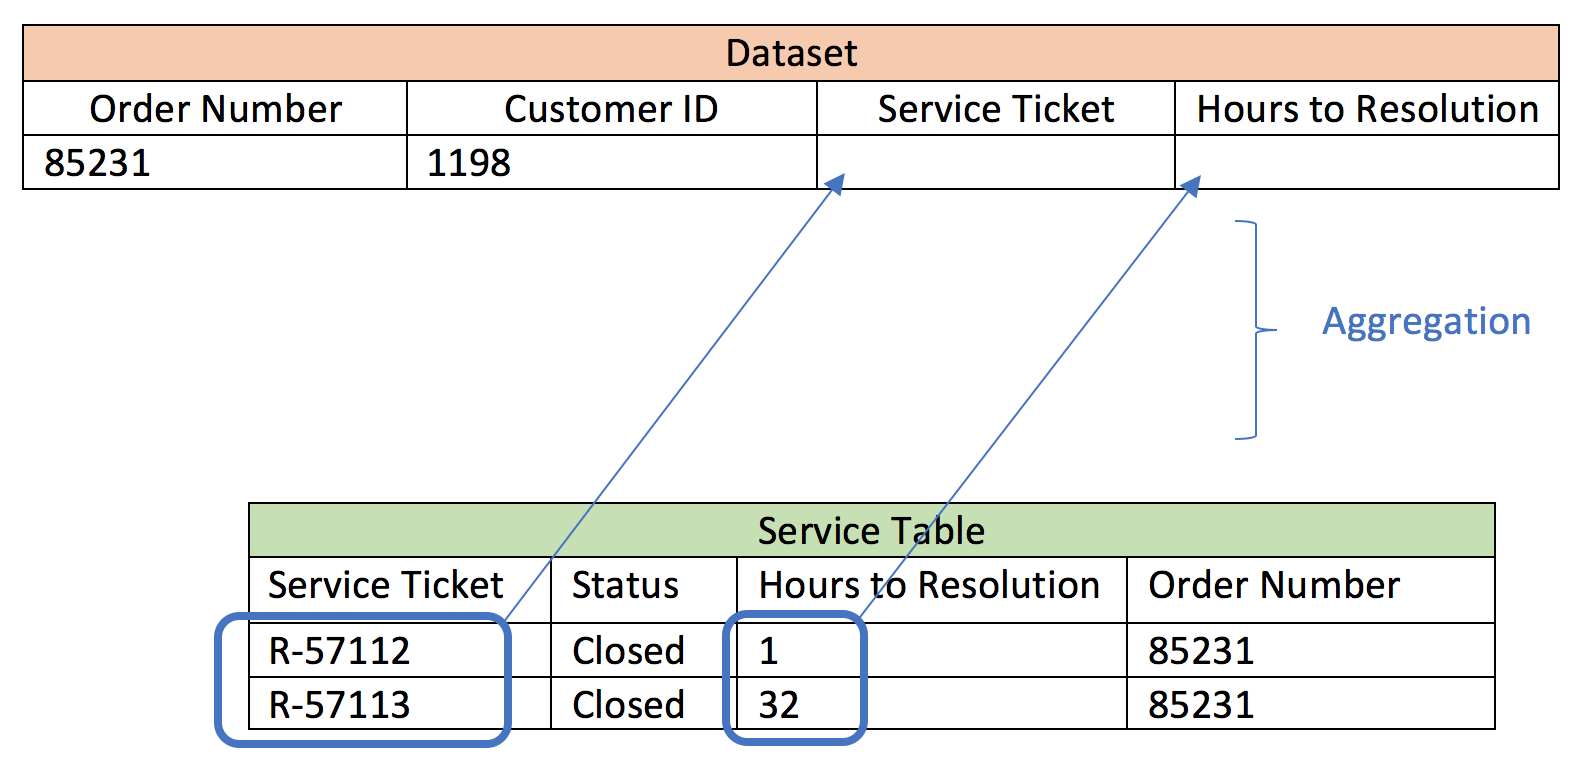
Dataset aggregations occur when you are trying to match one row of data in the Primary Table of a new Dataset to many rows of data from a Secondary Table. In the example below, because we are conducting a one to many join, we have to tell Numetric how to display multiple rows of data in a single row. This process is called aggregation.
Many Aggregation methods will only work with numerical Data Types and not with text. Additionally, some aggregations may not produce any meaningful output with your specific data (e.g. averaging four tracking numbers will provide you with a number, but it will have no meaning or value) so be thoughtful when selecting your aggregation method.
Note - Changing an aggregation method of a Dataset after it is tied to a Metric will cause the Metric to break. If you need to change the aggregation method, it may be best to create a new Dataset with the desired aggregation method.
Below is a list of the aggregations that can be carried out in Datasets, as well as a description of how that aggregation handles the aggregated values.
Each description also contains an example of how that aggregation method would aggregate the following values:
4
8
15
16
23
42
Total
Displays the sum total of all of the aggregated values.
Only available for numeric Data Types.
Example: 108
Average
Displays the average of all of the aggregated values.
Only available for numeric Data Types.
Example: 18
Count
Displays the number of aggregated values.
Available for all Data Types.
Example: 6
Minimum
Displays the smallest or lowest aggregated value.
Only available for numeric Data Types.
Example: 4
Maximum
Displays the biggest or highest aggregated value.
Only available for numeric Data Types.
Example: 42
Array
Displays all of the aggregated values as an array, with each value separated by a comma. Datasets with Array aggregated data will display each aggregated value correctly in Metrics or Charts and will work for searching or filtering aggregated data.
Available for all Data Types.
Example: 4, 8, 15, 16, 23, 42